
On the finance dashboard, manual reconciliation looks like one modest line - a few salaries in the back office. The real number is three to four times larger, and it grows with your transaction volume. Here is how a CFO should actually cost it, and where the money is hiding.
If you asked most payment or fintech CFOs what manual reconciliation costs, they would point to a salary line: two, three, maybe five people in the back office matching transactions against settlement files. It is a real number, it sits in the budget, and it is almost entirely the wrong number - because it is the only part of the cost that is visible on a dashboard. The reconciliation cost that actually matters is three to four times that figure, and unlike the salary line, it grows every time your volume does.
This article is for the person who has to justify the spend either way: keep paying the manual cost, or fund the automation that removes it. Here is how to actually put the numbers together.
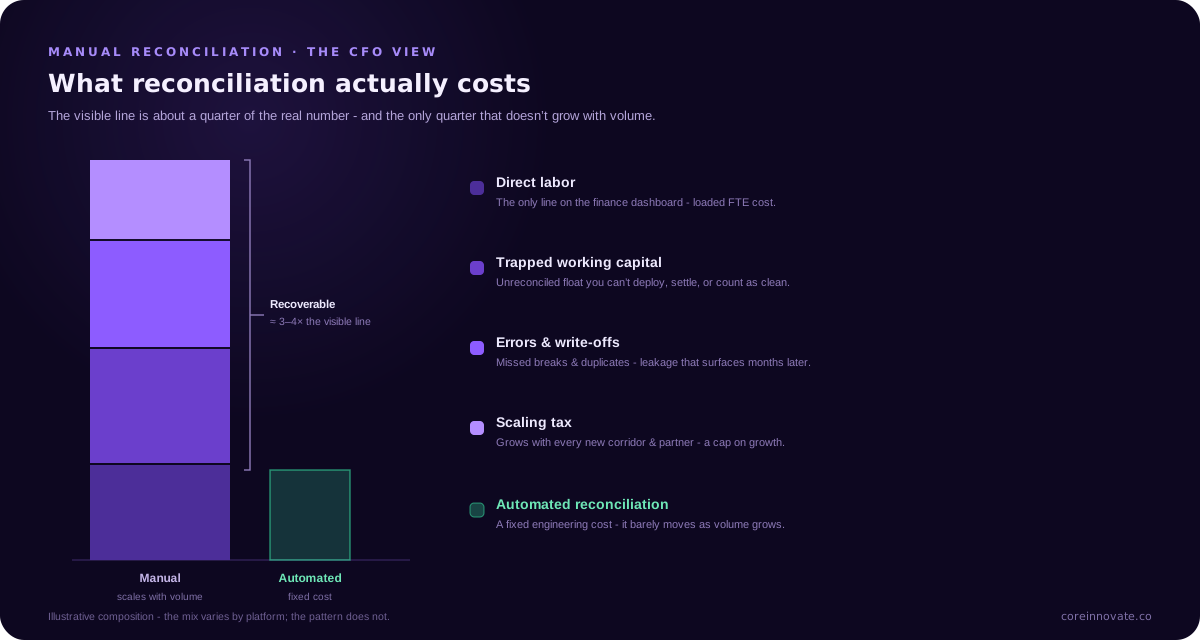
The one cost you see, and the three you don't
Manual reconciliation has four cost centers. Finance reports one of them.
1. Direct labor - the visible line. This is the one on the dashboard: the loaded cost of the people doing the matching. Loaded, not base - salary plus benefits, tooling, management overhead, and the real cost of the office they sit in. For a small team this is already six figures annually, but it is the smallest of the four numbers, and it is the only one anyone budgets for.
2. Trapped working capital - the invisible float. This is the one CFOs miss most often, and it is frequently the largest. Money that is unreconciled is money you cannot confidently deploy, settle, or count as clean. Every hour of reconciliation lag is working capital sitting in a suspense state - float you are not putting to work, settlements you cannot confirm to partners, balances you are carrying reserves against because you cannot yet prove them. On a platform moving meaningful daily volume, even a one-day reconciliation lag ties up a running balance that has a real cost of capital attached to it. That cost never appears on the reconciliation line - it hides in your treasury and your reserves.
3. Errors and write-offs - the leakage. Manual matching has an error rate, and in payments, errors are not typos - they are money. A missed break becomes a write-off. A duplicate that is not caught becomes a double payout you may never recover. A reconciliation delta that is closed by "adjustment" rather than investigation is a loss you have chosen not to see. Even a fraction of a percent of transaction value slipping through as unrecovered breaks, on a large monthly volume, dwarfs the salary line. This is the cost that shows up months later, as a number nobody can quite explain.
4. The scaling tax - the growth cap. This is the strategic one. Manual reconciliation cost scales with transaction volume: double the transactions, and you need close to double the people, or you accept a growing backlog. That means every new corridor, every new partner, every growth milestone adds reconciliation headcount - a tax on exactly the growth you are trying to fund. Automated reconciliation cost, by contrast, is largely fixed: it processes ten million transactions at nearly the same cost as one million. The gap between a fixed cost and a linear one is the whole argument, and it widens every quarter you grow.
Putting numbers to it
Take an illustrative platform - substitute your own figures and the shape holds.
Say it processes 1,000,000 transactions a month at an average value of USD 50, and 0.5% of transactions require manual intervention to reconcile, at 10 minutes each, with a fully-loaded operations cost of USD 25 per hour.
- Direct labor: 5,000 interventions × 10 min = ~833 hours/month × USD 25 = ~USD 21,000/month (~USD 250K/year). This is the visible line.
- Errors and write-offs: if even 0.1% of transaction value settles as unrecovered breaks and duplicates, that is 0.1% × (1M × USD 50) = USD 50,000/month in leakage. Already more than double the labor line.
- Trapped working capital: a one-day average reconciliation lag on daily throughput of ~USD 1.6M holds roughly that sum in suspense; at a conservative cost of capital, the carrying cost runs into the thousands per month - and rises with every day of lag and every point of growth.
- The scaling tax: none of the above is static. At 2M transactions/month, the labor and leakage lines roughly double while an automated system's cost barely moves.
The visible line said ~USD 21K/month. The real number, before you even price the growth cap, is comfortably north of USD 70K/month - and climbing. That is the figure to compare against the cost of fixing it.
The ROI reframe
Here is the framing that makes the business case straightforward, because it is the one your board already understands: you are spending X on a problem that grows, to avoid spending Y on a fix that does not.
Automated reconciliation is a fixed, mostly one-time engineering investment plus a small run cost. It does not scale with volume. So the comparison is not "expensive project versus free status quo" - the status quo is not free, it is a rising operating cost with a leakage tail and a growth cap attached. Plotted over time, the manual cost line climbs with your volume while the automated line stays flat, and the two cross. Everything to the right of that crossover is recovered margin.
In the engagements where we have done this work, the payback is measured in months, not years - because the recovered write-offs alone often cover the engineering cost before the labor savings are even counted. We walked through the mechanics of one such case, from the finance side, in the context of infrastructure spend in How to Reduce Payment Infrastructure Costs by 30%; reconciliation is the same argument applied to your operations line.
What "automated" actually means here
For a CFO, the technical detail matters only insofar as it explains why the cost profile is different. In short: instead of people matching files after the fact, reconciliation runs continuously against the platform's own record of every transaction, matching automatically and surfacing only the genuine exceptions - the small number of real breaks - for a human to judge. The team stops matching and starts investigating, which is both cheaper and where their expertise actually adds value. The engineering that makes this possible is a question of ledger and event design, which we cover for a technical audience in Ledger Design Principles for Wallet Platforms and, at the operations level, in The Hidden Cost of Manual Reconciliation in Wallet Platforms. This is core wallet and ledger engineering work.
The takeaway for the finance seat is simple. The reconciliation cost on your dashboard is the tip of the number. The real cost is three to four times larger, it leaks, and it grows with the business - which means the automation that removes it is not a cost center, it is one of the cleaner ROI cases on your infrastructure roadmap.
If you want that number for your platform specifically - the real one, across all four cost centers, with the payback period attached - that is exactly what our architecture assessment produces: a direct read on what your current reconciliation approach actually costs you, and what it would take to stop paying it.
CoreInnovate
Working on a payment platform challenge?
Our specialist engineers work directly with payment gateways, wallet providers, and fintech platforms. Start with a scoped architecture assessment.