
Cloud Overspend in Payment Infrastructure: Where the 25-40% Hides
On payment platforms, cloud cost grows faster than transaction volume when nobody is managing the architecture - and the waste is not random, it hides in the same five places every time. Here is where the recoverable 25-40% actually lives, and why it is an architecture problem before it is a billing one.
There is a number we see again and again when we audit the cloud bill of a payment platform: somewhere between a quarter and two-fifths of monthly spend is recoverable without touching a single feature or degrading a single SLA. It sounds too high until you look at where it comes from - and then it is obvious, because the waste is never spread evenly. It concentrates in the same five places on almost every platform, for the same architectural reasons.
The distinction that matters is this: cloud overspend on a payment platform is not primarily a procurement problem to be solved with better discounts. It is an architecture problem that shows up on the invoice. You can negotiate the rate on waste, but you are still paying for waste. This article is about where the recoverable 25-40% hides, and why finding it is an engineering exercise, not a billing one.
Why payment platforms overspend by default
Cloud cost grows in proportion to transaction volume only if the architecture is managed for it. Left alone, it grows faster than volume - and payment platforms are especially prone to this, for three reasons.
They are provisioned for peak, permanently. A platform that must survive payday and Eid weekends is often sized for that peak all month long, paying peak rates through the quiet 90% of the time. They are latency-sensitive, so teams over-provision defensively - a little extra headroom on every service, multiplied across dozens of services, becomes a large standing bill. And they are built under delivery pressure, where "make it work, we will optimize later" is a rational call in the moment that quietly compounds, because "later" rarely comes with a budget attached.
None of this is negligence. It is the default trajectory of an unmanaged cost surface. The waste accumulates in predictable places - so let us name them.
The five places the money hides
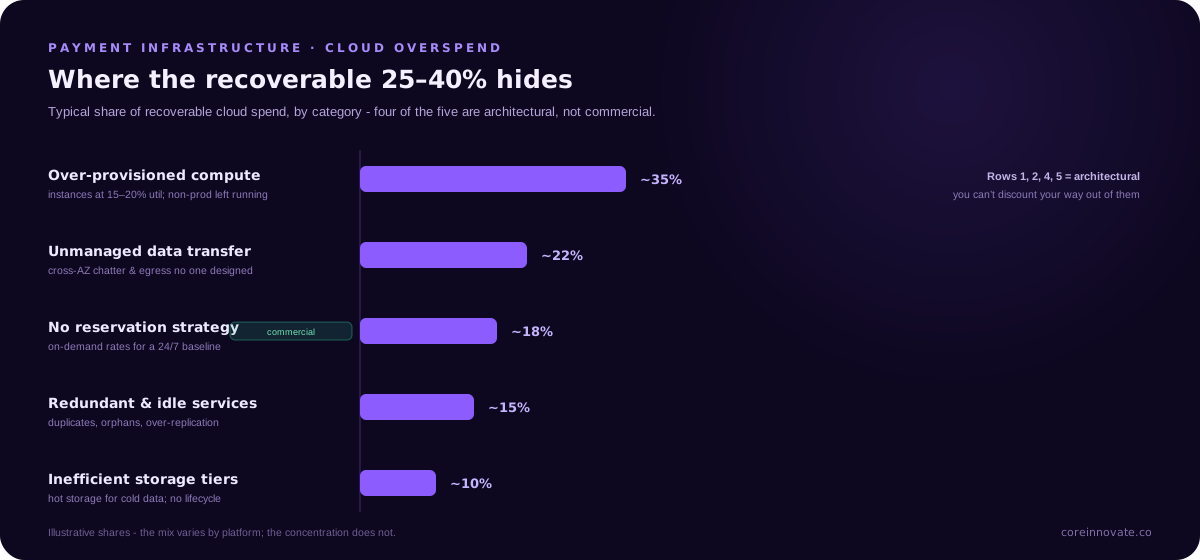
1. Over-provisioned compute - typically the largest share. The single biggest line is almost always compute that is sized far above what it uses. Instances running at 15-20% average utilization "for safety," non-production environments provisioned like production and left running overnight and over weekends, and autoscaling configured with floors so high it never actually scales down. Right-sizing against real utilization, and letting workloads scale to their actual demand curve, is usually the largest single recovery.
2. Unmanaged data transfer - the invisible line. Data transfer and egress is the cost almost nobody watches until it is audited, because it does not map to a server you can see. Chatty inter-service traffic across availability zones, data pulled across regions that did not need to be, and egress paths that were never designed all accrue silently. On a transaction-heavy platform moving data between services on every payment, this line is frequently far larger than anyone expects.
3. No reservation strategy - paying on-demand for a steady baseline. Every payment platform has a predictable baseline load that runs 24/7 - and paying full on-demand rates for capacity you will demonstrably use every hour of every day is leaving a straightforward discount on the table. The absence of a commitment strategy (reserved capacity or savings plans matched to the real baseline) is pure, recoverable margin, and it requires no architectural change at all - only the discipline to commit to the load you already know you carry.
4. Redundant and idle services - the accumulation. Over time a platform accumulates things nobody switched off: duplicate services doing the same job after a migration, orphaned resources from decommissioned features, over-replicated components carrying more redundancy than their tier requires, and managed services provisioned for a use case that changed. Individually small, collectively significant - and pure waste, because they serve no live traffic.
5. Inefficient storage tiers - the slow leak. Storage is where cost leaks slowly and permanently: hot, expensive storage holding data that is never read, logs and backups retained far longer than any policy requires, and no lifecycle rules moving aged data to cheaper tiers. It rarely spikes, so it rarely gets attention - it just compounds quietly, month after month.
Add these together and the 25-40% stops looking surprising. We walked through the finance-side ROI of this recovery in general terms in How to Reduce Payment Infrastructure Costs by 30%; this is the engineering map of where that 30% actually comes from.
Why it is an architecture problem, not a billing one
Here is the part that matters for how you fix it. Four of these five are architectural - how compute is sized, how services talk to each other, what redundancy the design carries, how data ages through storage. Only one, the reservation strategy, is purely commercial. That ratio is the whole point: you cannot discount your way out of an architecture that generates waste. A cost-optimization tool can flag an idle instance, but it cannot tell you that two services are doing the same job, that your inter-service chatter crosses zones unnecessarily, or that your autoscaling floor is set where it can never help. Those require someone who reads the architecture, not just the invoice.
This is also why the recovery is durable. Renegotiating a rate saves money until the contract renews; re-architecting the cost surface changes the slope of the line - so the platform stops overspending by default as it grows, instead of accumulating new waste at the old rate. It is the same discipline behind Scaling Payment Gateways Beyond 1 Million Transactions Per Day: the goal is cost that scales with volume, not ahead of it. And crucially, it depends on being able to see the spend at the level of services and workloads, not just the monthly total - the same transaction-level observability we cover in Observability for Transaction-Critical Systems, applied to cost.
Finding your number
The 25-40% is a pattern, not a promise - your figure depends on how long the platform has run unmanaged and how much of the five above has accumulated. But it is a measurable number, and finding it is fast: it is a read of your architecture and your bill together, mapping spend to the five categories and separating the recoverable from the necessary.
That is exactly what our infrastructure and cloud cost optimization work does, and what our architecture assessment will surface for your platform specifically: where your spend is concentrated, how much of it is the recoverable 25-40%, and the prioritized path to getting it back - without touching a feature or an SLA.
CoreInnovate
Working on a payment platform challenge?
Our specialist engineers work directly with payment gateways, wallet providers, and fintech platforms. Start with a scoped architecture assessment.